From Clicks to Revenue: How to Actually Prove Marketing ROI
Walt Ogonek | March 24, 2026 | 10 min read
The measurement gap is widening. Here's how manufacturing, industrial, and B2B marketers can close it—and build reporting their leadership will actually trust.
Industrial marketing used to be pretty straightforward: trade shows, distributor relationships, and a steady flow of RFQs from buyers who already knew what they needed. Today, those same buyers are researching solutions online, building shortlists, and forming strong opinions—long before they ever talk to your sales team. Most of that journey is invisible to you.
At the same time, your ad platforms are reporting metrics that look great in a dashboard but rarely connect to what actually matters: pipeline activity and closed revenue. Google might tell you your campaigns generated 40 conversions last month. LinkedIn says your cost-per-lead is down. But your sales team is shrugging.
If you're a B2B company investing in digital marketing, you've probably felt this disconnect:
- Traffic and search rankings are up, but qualified leads are flat
- Paid advertising shows positive ROAS, but sales can't see any impact
- Leadership is asking harder questions about ROI—and marketing doesn't have clear answers
This is the measurement gap. And in 2026, it's getting wider.
The reality: attribution is broken—especially in B2B
Most marketing measurement frameworks were built for ecommerce: a customer sees an ad, clicks, and buys—usually within 24 hours. Attribution is clean, the data is complete, and the math is simple. B2B is nothing like this. Sales cycles stretch weeks or months, sometimes even years. Buying decisions involve multiple stakeholders. And most of the meaningful activity—research, comparison, internal discussions—never shows up in your analytics at all.
Why last-click attribution fails
Last-click attribution assigns 100% of the credit for a conversion to the final touchpoint—typically a branded search or direct visit. This seems logical on the surface, but it's misleading. Consider a realistic scenario: a procurement manager reads a thought leadership article about your solution category in January. In February, a colleague sees one of your LinkedIn ads. In March, the same company reads three pages on your site. Then in April, their VP Googles your brand name and fills out a contact form.
Last-click attribution credits that branded Google search with the entire deal. But the branded search didn't create the interest—it just harvested it. Every upstream touchpoint that built awareness and intent gets zero credit. This causes marketers to systematically over-invest in the bottom of the funnel (branded terms, retargeting) while starving the top-of-funnel activity that actually generates demand.
For a deeper look at attribution model limitations, Google's own documentation on attribution models illustrates how dramatically reported performance can shift depending on which model you use.
Platform reporting is biased by design
Google Ads and LinkedIn don't just measure performance—they estimate it, using models that are optimized to make their platforms look effective. This creates a few specific problems:
- Modeled conversions: When Google can't directly observe a conversion (because a user switched devices, cleared cookies, or used a privacy browser), it uses machine learning to estimate whether the conversion likely happened. These modeled conversions are included in your reported totals—but they're projections, not confirmed events.
- View-through attribution: LinkedIn counts a conversion as 'attributed' if someone saw your ad (even for one second without clicking) and later converted on your site—sometimes up to 30 days later. In a long B2B sales cycle, this window captures enormous amounts of activity that had nothing to do with the ad impression.
- Cross-platform double-counting: If a buyer sees a LinkedIn ad on Tuesday and a Google Display ad on Thursday, then converts on Friday—both platforms will claim the conversion. Your total reported conversions from all platforms will frequently exceed the actual number of leads in your CRM.
The result: add up all your platform-reported conversions and you'll typically see a number 2–5x higher than what your CRM actually received. The platforms aren't lying, exactly—but their measurement methodology is optimized to justify continued spend, not to give you an accurate picture of incrementality.
Privacy changes made things even more difficult
The deprecation of third-party cookies, Apple's iOS tracking restrictions (App Tracking Transparency), and the rise of privacy-focused browsers have collectively punched a significant hole in digital marketing measurement. Pixel-based tracking now misses an estimated 30–60% of conversions in many B2B markets, depending on the audience's technical sophistication and device usage patterns.
This doesn't mean measurement is impossible—but it does mean that raw platform data is less reliable than it was three years ago. The gap between 'reported' and 'actual' performance is wider than ever, and it's likely to keep growing as privacy norms continue to tighten.
The shift to business metrics
The solution isn't to find a better attribution model—it's to stop trying to attribute individual conversions to individual clicks, and instead measure what your business actually cares about. This means anchoring your reporting in business-level metrics rather than platform-level metrics.
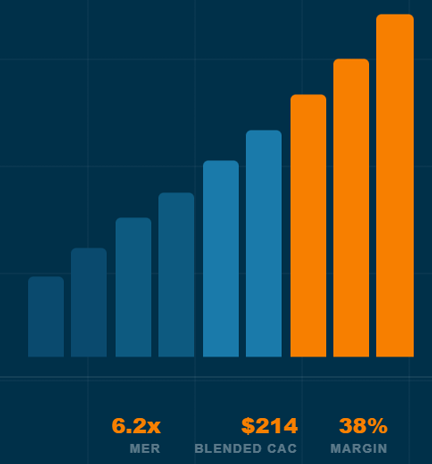
Marketing Efficiency Ratio
The Marketing Efficiency Ratio (MER = total revenue ÷ total marketing spend) is deliberately simple. It doesn't try to credit individual channels or campaigns. It just asks: for every dollar we put into marketing, how many dollars came out the other end? A manufacturing company with a 6-month sales cycle can track MER monthly and watch how it responds as they shift budgets between channels—no pixel-perfect attribution required.
MER is especially useful as a leadership metric because it's grounded in numbers your finance team already tracks. There's no black-box modeling, no platform-specific definitions, and no way for it to be inflated by view-through conversions.
Blended Customer Acquisition Cost
Most companies calculate Customer Acquisition Cost (CAC) by channel—'our paid search CAC is $X, our SEO CAC is $Y.' This creates the illusion of precision while hiding a structural problem: channels don't operate independently. Your SEO content builds awareness that makes your paid retargeting more effective. Your trade show presence generates branded searches. When you calculate CAC in isolation by channel, you're measuring a system as if it's a collection of separate machines.
Blended CAC—total spend across all marketing divided by total new customers—is less granular but more honest. Track it over time. If it's stable or declining while revenue grows, marketing is working. If it's rising, something needs to change—regardless of what any individual platform is reporting.
Contribution Margin
Revenue growth that erodes margins isn't growth—it's just activity. Tracking contribution margin (revenue minus variable costs) ensures your marketing investments are generating profitable demand, not just top-line numbers. This is especially relevant in manufacturing and industrial markets where deal sizes vary significantly and not all new customers are equally valuable.
Incrementality testing: the closest thing to truth
If attribution models tell you what happened, incrementality testing tells you what wouldn't have happened without your marketing. It's the most honest form of measurement available—and it's underused in B2B.
The core question incrementality testing answers: if we hadn't run this campaign, how many fewer customers would we have acquired? This is different from 'how many conversions did this campaign touch?' It's asking whether the campaign actually caused anything.
Practical incrementality tests for B2B
Branded search holdout
Pause branded search campaigns for 2–4 weeks in a defined period. Measure whether organic branded traffic fills the gap—or whether total branded conversions decline. In most B2B cases, branded paid search is largely redundant with organic branded results: the people searching your company name were already going to find you. This test often reveals that branded search spend has near-zero incremental value. For more on this methodology, see Google's guide to conversion lift studies.
Regional spend variation
Reduce spend in one geographic region or vertical while maintaining it in comparable regions. Compare performance metrics across groups over 6–8 weeks. This is particularly useful for manufacturing companies with clear regional sales territories, where you can measure pipeline impact directly in the CRM.
Channel on/off test
Turn off a paid channel entirely for one month while holding everything else constant. If qualified lead volume doesn't change, the channel wasn't generating incremental demand—it was taking credit for demand that other channels (or organic) were already creating. If volume drops meaningfully, the channel is earning its budget.
Incrementality tests require patience—B2B sales cycles mean you often can't see the full effect for 60–90 days after a test ends. But even directional results give you more useful information than an attribution model can.
How SEO, Paid Media, and Conversion Rate Optimization Work Together
One of the most common mistakes in B2B marketing measurement is evaluating SEO and paid media as if they're competing channels. They serve fundamentally different roles in the buyer journey, and the relationship between them is more complementary than competitive.
SEO drives early research and demand
Search engine optimization captures buyers at the research stage—people who are defining their problem, exploring solution categories, and building vendor shortlists. This is where most of the B2B buyer journey actually happens. A 2023 Gartner study found that B2B buyers spend only 17% of their total purchase journey time meeting with potential suppliers—the rest is spent in independent research, much of it online. SEO is how you participate in that independent research phase.
Paid media captures and accelerates demand
Paid search and social capture buyers who already have intent—they know the category, they're comparing vendors, and they're ready to engage. Paid media is most effective when SEO has already done the awareness work. Without that foundation, paid campaigns are introducing your brand and trying to close simultaneously, which is expensive and inefficient.
CRO improves conversion efficiency across all channels
Conversion rate optimization determines how much of the traffic that SEO and paid media deliver actually turns into leads and customers. A 20% improvement in conversion rate is worth the same as a 20% increase in traffic—but typically costs far less. CRO is the multiplier that makes every other channel more efficient. Tools like VWO and Hotjar can help identify where visitors drop off before converting.
Optimizing any one channel in isolation—without considering the others—leaves significant value on the table. A company that slashes paid media to fund SEO will see near-term revenue decline even if the long-term strategy is sound. A company that optimizes paid campaigns without improving conversion rates is paying to send traffic to a leaky bucket.
What to actually track
Here's a practical measurement framework for B2B and industrial companies. The goal is a weekly or monthly reporting cadence that leadership can engage with—not a 47-metric dashboard that nobody reads.
Core business metrics (review monthly)
- MER — total revenue ÷ total marketing spend, trended over 6–12 months
- Blended CAC — trended monthly, segmented by new vs. returning customers where possible
- Revenue from marketing-sourced pipeline — requires clean CRM tagging, but is the most direct measure of marketing's contribution
- Conversion rate — from marketing-qualified lead to closed-won, tracked by source
Channel health metrics (review weekly for optimization)
- Organic traffic and rankings for target keyword clusters—directional signals, not revenue proxies
- Paid CPL and ROAS—useful for bidding decisions within platforms, but not for cross-channel or leadership reporting
- Form conversion rate by landing page—a CRO input, not a business outcome
Tools
- Google Analytics 4 — for behavioral data and traffic analysis. Use it for directional signals, not attribution truth.
- Your CRM (HubSpot, Salesforce, etc.) — this is your source of truth for pipeline and revenue. If it's not tagged cleanly by lead source, fixing that is the highest-leverage measurement investment you can make.
- Ad platforms — for campaign optimization within platforms. Do not use platform-reported conversions as a business metric.
Clarity
You won't get perfect visibility into your marketing ROI. The buyers' journey is too complex, the tracking too fragmented, and the sales cycles too long for any measurement system to give you certainty. But perfect measurement isn't the goal—clarity is.
Clarity means knowing, with reasonable confidence, whether marketing is contributing to growth. It means having a conversation with your leadership team that's grounded in revenue and customer acquisition, not click-through rates and impression share. And it means making budget decisions based on evidence rather than platform-reported metrics that are optimized to justify spend.
The companies that win in B2B marketing over the next few years won't necessarily be the ones with the best attribution models. They'll be the ones who accepted that attribution is imperfect, built a business-level measurement framework anyway, and made better decisions as a result.
Firetail Search helps manufacturing and industrial companies measure what actually matters—revenue. If your marketing reporting is built around platform metrics rather than business outcomes, Contact Us.